There is no escaping the fact that we have an ageing population, with more of us living longer than ever before. Almost 2 in 5 (40%) of those in England are now over 50 and around 1 in 5 (20%) are over 65.
We have seen a shift in our overall age profile – the number of people aged 65 and above in 2023 was approximately 50% higher than it was in the early 1980s, with almost 3 times more people aged 85+ by comparison.
As a result, a growing proportion of people are looking to give up work and enjoy their retirement years. With this in mind, we have compiled the latest UK retirement statistics for 2024 to show how these trends and patterns have changed over time and what the future might hold for pensioners in the UK.
Top UK retirement statistics 2024
- The average retirement age in the UK is 66.
- There are approximately 11 million people aged 65 and above in the UK, accounting for around 16% of the overall population.
- According to the most recent ONS figures, around 7 in 10 (70.3%) women and 3 in 5 (61.4%) men are retired in the UK.
- With 1.7 million, the South East has more retired people than any other region, with almost 1 in 5 (19.45%) residents aged 65 and above. By 2041, almost a quarter (24.64%) of the North East could be retired – the highest across all UK regions.
- Around 1 in 10 (9%) UK baby boomers have no intention of giving up work beyond the age of 66.
- According to the Retirement Living Standards, a single retired person in the UK needs to earn at least £14,400 a year to have a minimum standard of living. This rises to £22,400 for a retired couple.
- Approximately 1 in 7 (14%) people aged 55+ are actively considering downsizing their property, with more than two-fifths (43%) claiming this will fund their lifestyle once they retire. [source: Audley Villages consumer research 2022]
- There are around 70,000 integrated retirement communities in the UK, providing homes for 90,000 older people (0.6% of the over-65 population).
- Reported health benefits of living in a retirement community include a 75% increase in exercise, a quarter (24%) decrease in anxiety levels, and fewer unplanned hospital stays.
- Those of retirement age in the UK tend to score highest amongst all groups regarding happiness, life satisfaction, and how worthwhile they perceive their life to be, with average scores of 7.75, 7.98, and 7.74 out of 10, respectively.
- Just under two-fifths (38%) of people aged 55+ have experienced loneliness in the past 12 months. [source: Audley Villages consumer research 2022]
- The healthiest parts of the UK for people aged 65 and above are in the South East and South West, where 37% and 36% of people rated their health as good.
UK retirement population statistics
How many UK pensioners are there?
According to the most recent ONS figures, there are just over 11 million people in the UK aged 65 and above.
A breakdown of UK pensioner population statistics
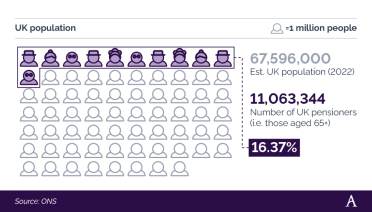
With an estimated population of almost 67.6 million, this means around 1 in 6 (16.37%) of us are currently within the UK pensioner population.
Number of retired people in the UK over time
Back in 1981, there were around 4.3 million people in the UK of retirement age, accounting for around 1 in 12 (8%) of the total population.
By 2021, this percentage figure had doubled resulting in more than 10.5 million people aged 65 and above.
A breakdown of the number of economically inactive people in the UK classified as retired between 1981 and 2041
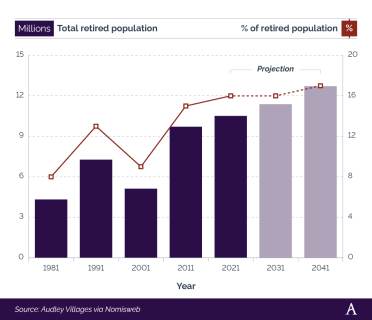
Based on these trends, we could see 17% of the UK population over the age of 65 by 2041, resulting in more than 12.7 million people nationwide who are eligible for retirement.
A breakdown of the number of people in the UK aged 90 and above between 1990 and 2022

According to the ONS, as of 2022, there were just over 550,000 people in the UK aged 90 and above, with the overwhelming two-thirds majority (67.2%) made up of women.
Despite a few blips, the number of UK residents aged 90+ has generally risen year-on-year since 1990. Back then, there were almost 215,000 people in this age bracket. However, by 2022, this figure had risen by more than two-and-a-half times (+156%) to 550,835.
UK retirement statistics by location
According to the latest ONS statistics, the South East has the largest retired population across England and Wales, with just over 1.7 million aged 65+, as of 2024. This accounts for around 1 in 5 (19.45%) of the region’s population and around 1 in 6 (16.31%) of the total population aged 65 and above.
A breakdown of the proportion of people aged 65+ in England and Wales by region (as a percentage of the overall retired population)

By contrast, the North East has the lowest number of people aged 65 and above. At 540,558, this equates to just over a fifth (20.42%) of the region’s population, yet less than one-twentieth (4.89%) of those aged 65+ across England and Wales.
Incidentally, there are just over a million people in London aged 65 and above, yet this represents around 1 in 9 (11.24%) inhabitants. Conversely, the South West has the third highest number of retired people of any region across England and Wales, which accounts for more than a fifth (22.34%) of the area’s overall population – double the percentage figure for London.
A breakdown of the number of people aged 65+ in England and Wales by region (1981-2041)
In all, the retired population in England and Wales more than doubled (+143%) between 1981 and 2021.
The population of those aged 65+ trebled in the East during this period – the biggest increase of all regions – whereas London’s elderly population increased by almost half (+46%).
By 2041, it’s predicted that the South East could see more than 1.8 million people aged 65 and above. Yet, this will represent one of the smallest percentage increases during this period across all regions (+8.33%). The largest percentage rise is forecast to be in the North East (+29.92%).
A breakdown of the proportion of people aged 65+ in England and Wales by region over time (as a percentage of the overall population)
| Region | 1981 | 1991 | 2001 | 2011 | 2021 | 2031 | 2041 |
|---|---|---|---|---|---|---|---|
| North East |
7.80% |
14.25% |
10.83% |
19.84% |
19.96% |
22.33% |
24.64% |
| North West |
9.07% |
14.86% |
10.20% |
18.75% |
18.09% |
19.70% |
21.07% |
| Yorkshire and the Humber |
8.58% |
14.76% |
10.25% |
19.14% |
18.37% |
20.06% |
21.69% |
| East Midlands |
8.15% |
14.50% |
10.19% |
19.86% |
18.76% |
19.74% |
21.17% |
| West Midlands |
8.11% |
14.28% |
9.95% |
18.81% |
17.60% |
18.79% |
19.93% |
| East |
8.09% |
14.00% |
10.06% |
19.74% |
18.65% |
19.89% |
21.51% |
| London |
9.18% |
12.93% |
7.10% |
12.22% |
10.01% |
10.37% |
10.52% |
| South East |
8.71% |
13.95% |
9.63% |
18.99% |
18.27% |
17.01% |
17.96% |
| South West |
10.04% |
15.94% |
11.07% |
21.79% |
21.13% |
19.20% |
20.03% |
| Wales |
8.66% |
14.59% |
10.56% |
20.64% |
20.34% |
19.35% |
20.73% |
| Source: Audley Villages via Nomisweb | |||||||
Since 1981, the retired population as a percentage of the overall population has generally increased for all regions of the UK. In some parts, such as Yorkshire and The Humber, the Midlands, and the South, this figure has more than doubled, whereas in Wales the 2021 percentage figure is almost two-and-a-half times greater than in 1981.
Incidentally, the proportion of people aged 65+ in the capital changed very little when comparing 1981 to 2021 statistics (+0.83 percentage points), yet the yearly change fluctuated between 7-13% over these 4 decades.
By 2041, it’s estimated that almost a quarter (24.64%) of the North East population will be over 65 – the highest percentage across all UK regions. This is contrasted by just 1 in 10 (10.52%) of Londoners who will have almost reached retirement age.
Yorkshire and The Humber should also see their elderly population increase by 2041 to more than a fifth (21.69%) – the second highest percentage across England and Wales.
UK retirement age statistics
According to a 2023 study by the Institute for Fiscal Studies (IFS), UK employment rates decline significantly after the age of 55, with a resulting increase in the figures for self-reported retirement.
At 55 years old, around 4 in 5 (81%) men are in paid work. This drops by almost half to 44% by the age of 65. For women, the respective figure falls from almost three-quarters (74%) to just over a third (34%).
Average retirement age in the UK
According to the 2021 UK Census, around two-thirds (65.85%) of people aged 66 are retired – a drop of more than 7% from 10 years earlier. This may be attributed to the abolishment of the Default Retirement Age (DRA) in 2011, which meant employers could force people to retire at 65.
This would also help to explain why more than two-thirds (68.15%) of people were retired by the age of 65 in 2011, yet the corresponding figure for 2021 was just over two-fifths (41.55%) – a difference of 26.6 percentage points.
A breakdown of the average percentage of retired people in the UK by age
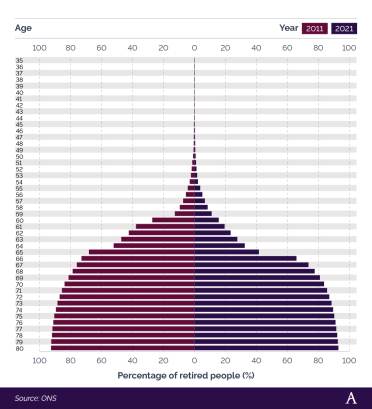
As of 2021, almost three-quarters (73.6%) of people are retired by the time they reach their 67th birthday – just 2.4% less than in 2011.
Back in 2011, more than 1 in 4 people (27.25%) were retired by the age of 60. Yet, 10 years later, this figure had almost halved to 15.6%.
Average UK retirement age over time
The State Pension has been a key pillar of the UK’s welfare system since it was introduced back in the 1940s. For 62 years, the State Pension age was 60 for women and 65 for men.
The Pensions Act 1995 increased the State Pension age by 5 years for women to bring it in line with men for an equalised system thereon.
A breakdown of the UK state retirement age (1948–2046)
| Date | State Pension age (women) | State Pension age (men) |
|---|---|---|
| 1948–2010 | 60 | 65 |
| 2010–18 | 65 | 65 |
| 2018–20 | 66 | 66 |
| 2026–28 | 67 | 67 |
| 2044–46 | 68 | 68 |
| Source: Department for Work & Pensions | ||
Average life expectancy in the UK was 10 years higher in 2020 compared to 1951 (88.75 vs. 78.4). By 2070, this figure is forecast to reach 92.5 for men and 94.6 for women.
As a direct result, the Pensions Commission in 2005 recommended increasing the State Pension age, to cope with an ever-ageing population. As of 2024, the age at which you can claim a State Pension stands at 66. This is anticipated to rise to 67 between 2026-28 and remain in place until 2043, after which it may increase further to 68.
'Baby boomers' – retirement statistics
In a survey of 1,272 UK baby boomers aged 58-75, Dunstan Thomas found that almost half (49%) were not yet retired, with a similar percentage (47%) aiming to remain in part-time work once they reach retirement age.
A breakdown of UK baby boomer working habits after retirement
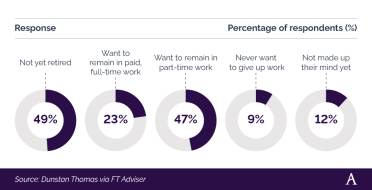
Around one in four (23%) UK baby boomers intended to stay in full-time work by the age of 66, with around 1 in 10 (9%) claiming they have no intention of giving up work by this stage in their life.
A breakdown of defined benefit (DB) pensions and defined contribution (DC) pension statistics amongst UK baby boomers
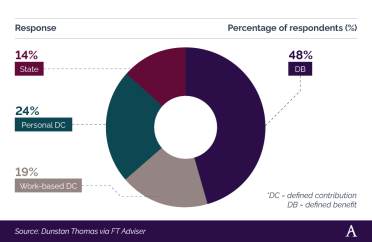
Dunstan Thomas also found that nearly half (48%) of UK baby boomers have a defined benefits (DB) pension, making it the most common amongst people aged 58-75.
This was followed by almost a quarter (24%) who have a personal defined contributions (DC) pension scheme as their primary income post-retirement, with almost a fifth (19%) relying on a work-based DC pension.
Around 1 in 7 (14%) of those baby boomers surveyed just had a State Pension in place.
A breakdown of future financial planning amongst UK baby boomers
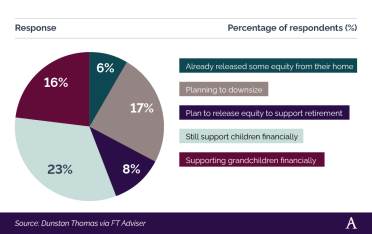
In terms of future planning, almost a fifth (23%) of UK baby boomers still support their children financially once they reach the age of 58, with 1 in 6 (16%) admitting this is also the case for grandchildren.
Almost a sixth (17%) are planning to downsize their home in the future, with around 1 in 12 (8%) admitting they are likely to release equity in their property to financially support their retirement years.
Further to this, a 2024 survey of 6,300 UK adults by Standard Life found that 14% of baby boomers and late Gen Xers have already “unretired” (i.e. are leaving retirement to rejoin the workforce), with a further 4% considering it in the future.

While a sixth (16%) of women aged 55+ are planning a career return, this figure rises to more than a fifth (21%) for men.
The main driving force behind this decision is money (or lack thereof). Their research shows:
- More than a third of respondents claim the cost of living is higher than they’d planned for.
- Around a quarter (24%) admit their retirement income is no longer enough to live on.
- Approximately 1 in 10 are postponing their retirement.
- About 3% are taking on an additional job to boost their income.
These trends are also felt across the pond, where the number of U.S. citizens working past 65 has quadrupled since the 1980s.
According to the Pew Research Center, around a fifth (20%) of Americans aged 65+ were employed in 2023 – almost double the amount 35 years previous. This constitutes around 7% of all wages and salaries paid by U.S. employers, a figure that made up just 2% in 1987.
UK downsizing statistics
Downsizing your property can be an effective way of turning your home into a retirement fund.
According to consumer research from Audley Villages in 2022, around 1 in 7 (14%) of those over 55 are actively considering downsizing their property, with the average person expecting to gain £63,572 in equity.
Of the financial gain received from downsizing:
- 43% wanted it to fund their lifestyle once they gave up work
- 41% claimed they would be using this for holidays
- 39% want to make improvements to their new home
- 22% will support family members getting onto the property ladder.
The most commonly cited reasons for downsizing include living in a more suitable property (71%), or one that doesn’t require so much maintenance (50%) or isn’t as expensive (50%).
When it comes to a future property, more than a third (35%) of those aged 18-54 said the most important factor was being able to have family stay over, with a slightly smaller percentage (32%) claiming it must be well-adapted for their needs.
Interestingly, just over a fifth (22%) of 18-54-year-olds wanted to stay in their current property when they retire, less than half the comparative figure for the over 55s (52%).
A breakdown of what over 55s expect from their property when they downsize
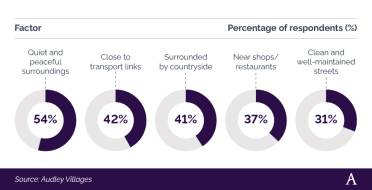
In terms of choosing a new place to live, for those over 55, more than half (54%) tend to prefer quiet and peaceful surroundings, compared to around two-fifths that want to be close to transport links (42%) and surrounded by countryside (41%).
Being near shops and restaurants was also considered important by almost 2 in 5 (37%) respondents, with just under a third (31%) claiming they looked for clean, well-maintained streets when downsizing. Integrated retirement communities provide a good option to find properties which meet these key purchasing criteria.
Read our blog on the potential tax breaks for downsizers to see if this is something you may consider doing in the future.
Millennials: retirement statistics
According to a 2024 YouGov survey, around half (48%) of millennials expect to retire between the ages of 61 and 70.
Almost a fifth (18%) of those aged 25-34 believe they won’t give up work until they reach 70 – twice as high compared to those aged 18-24.
A breakdown of when UK millennials expect to retire
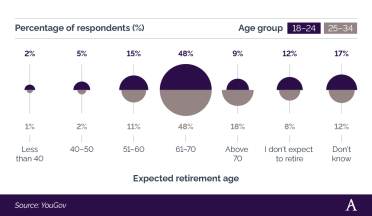
Incidentally, millennials aged 18-24 are slightly less optimistic about their future retirement age. Around an eighth (12%) believe they will never give up work, compared to around 1 in 12 (8%) of those aged 25-34.
A breakdown of how much UK millennials think you need for a comfortable retirement
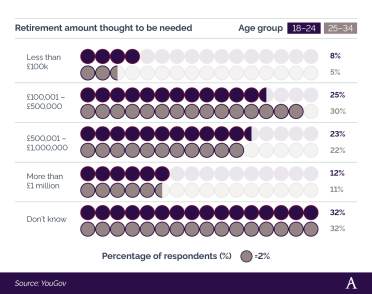
Less than a third (30%) of millennials aged 25-34 surveyed by YouGov believe you need between £100,001 and £500,000 for a comfortable retirement in the UK, a figure that falls to a quarter (25%) of those aged 18-24.
Respective percentages drop to 23% and 22% for those who think you need between £500,001 and £1 million to comfortably enjoy your retirement.
Around 1 in 9 (11.5%) UK millennials feel you need more than £1 million to support your retirement years and live comfortably once you give up work.
With the oldest millennials now in their early 40s (as of 2024), many will have careers, mortgages, and a family. They may therefore be looking to put plans in place for future retirement.

According to research from Standard Life, more than a quarter (28%) of millennials have done “a great deal of planning or thinking” when it comes to how much money they will need to live on post-retirement.
In their intergenerational audit, the Resolution Foundation concluded that rising house prices and excessive rental prices have impacted young people's ability to save for retirement. There are now 3 times more Millenials at the age of 30 living in privately rented accommodation compared to the baby boomer generation – and they are paying more.
It’s predicted that, after retirement, lifelong UK Millennial renters will need an extra £9,000 of annual income to cover their future cost of living compared to homeowners.
Higher earners who can save for a deposit and get on the property ladder may be slightly better off in the future, but not completely in the clear. On average, UK first-time buyers borrow more than three-and-a-half times their incomes, and as a result, could be hardest hit by any rise in interest rates. If house prices drop in the future, as many predict, younger people could end up with a negative equity on their property when they come to sell.
Want to know the difference between Boomers, Gen X, and Millennials? Read our blog on understanding the generation gap and what differentiates them from one another.
Earliest retirement age in the UK
In the UK, you can technically choose to retire whenever you want. However, this decision should not be taken lightly as you need to ensure you’re in a financially comfortable situation to do so.
The earliest you can retire and get your State Pension depends on your State Pension age. As of 2024, this is 66 for both men and women but is determined by your date of birth.
For personal and workplace pensions, you can normally start withdrawing money from your pension pot after you turn 55. However, this varies depending on which scheme you have and the associated terms and conditions.
For example, some people can access their pension early if they have a “protected pension age”. Those in certain professions with traditionally low retirement ages (such as sportspeople) may have the right to withdraw pension benefits before the age of 50 provided they joined the scheme before April 2006.
The UK government has already outlined plans to raise the National Minimum Pension Age (NMPA) to 58 on 6 April 2028.
You may also be able to take money out of your pension pot if you’re retiring early through ill health or you had the right under the scheme you joined before 6 April 2006.
However, this may be classed as an unauthorised payment and could be taxed up to 55%. It’s worth checking with your pension provider if you’re not sure whether this applies to you.
You may also be able to take your whole pension pot as a tax-free lump sum if all of the following apply to you:
- You’re diagnosed with a serious illness and expected to live less than a year
- You’re under 75
- Your whole pension pot does not exceed your lump sum and death benefit allowance.
It’s worth checking with your pension provider as some pension schemes will keep at least 50% of your pension pot for your spouse or civil partner after you die.
Gender differences in UK retirement age
According to ONS figures from the 2021 Census, around 7 in 10 (70.3%) women and 3 in 5 (61.4%) men are retired in the UK – a respective drop of 6.8% and 7.5% from 10 years previous. This can largely be explained by the removal of the Default Retirement Age (DRA) in 2011, which meant employers could force people to retire once they reached 65.
This would also help to explain why more than three-quarters (73.5%) of women and three-fifths (62.8%) of men were retired by the age of 65 in 2011, yet the corresponding figures for 2021 were 45.1% for women and 38% for men.
A breakdown of the percentage of retired males and females by age
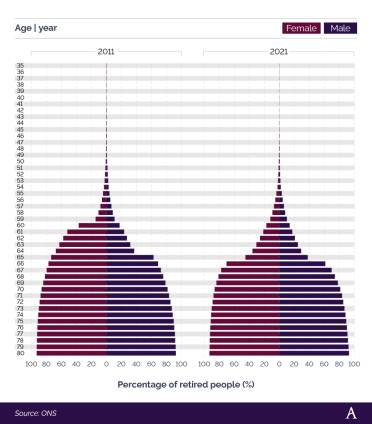
By the age of 70, the 2011 and 2021 retirement statistics for men and women are broadly in line with one another. However, after 73, there tend to be slightly more retired women (around 0.1-0.2%) in 2021 than in 2011. The first time that male retirement statistics for 2021 are higher than in 2011 is at the age of 80, where approximately 0.4% more have given up work by comparison.
The Gender Pensions Gap
The Gender Pensions Gap (GPeG) looks at the relative inequality between male and female pension provisions in the UK. It is defined as the percentage difference between the uncrystallised average private pension wealth of males and females around the normal minimum pension age (currently 55). This includes wealth that is active or preserved, but not in payment.
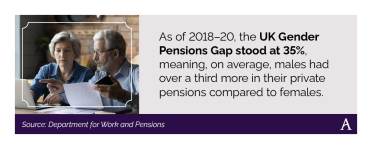
The most recent government data available from 2018-20 indicated a GPeG of 35%, meaning, on average, males have over a third more than females when it comes to their private pensions. This drops by 3% for those employees eligible for automatic enrolment (AE).
The size of the GPeG varies according to age bands. It is smallest for those aged 35-39 (10%) and increases to almost half (47%) for those aged 45-49 before falling again in the later years of working life.
It can also vary depending on the type of pension scheme you have in place. On average, the GPeG is greatest for those who only have a direct contribution (DC) pension – which also happens to be the most common type of pension. At 60%, this means females tend to have three-fifths less than their male counterparts with this scheme.
The second most common pension scheme in the UK is a defined benefit (DB) pension and has a GPeG of just over two-fifths (44%). This drops to just over a third (34%) in favour of males for those with a joint DB and DC pension pot.
While the Gender Pensions Gap has fluctuated over time, the average female pension wealth around the national minimum pension age (NMPA) has increased in real terms since 2006-08.
In 2006-08, the average female had £50,000 of private pension wealth at the age of 50-54 compared to £85,000 for an equivalent male. By 2018-20, this has risen by 90% for females (to £94,000) and 70% for males (to £145,000) in real terms.
Best time of year to retire in the UK
Knowing when to retire is unfortunately not a straightforward answer as it relies on several factors. It can also vary from person to person and is dependent on their circumstances.
One of those factors is the rate of withdrawal. A widely used measure for sustainable pension withdrawal from investments is the ‘4% rule’ This denotes that you should be able to comfortably take out 4% of your investment each year and escalate that amount year-on-year by the rate of inflation. In all, the theory is that your investment fund should last at least 30 years.
Using this theory, Fidelity looked into the best and worst moments to retire between 2000 and 2018. Their 2023 longitudinal study analysed two hypothetical pension funds of £100,000 to see their relative values over time, one starting in 2000 and the other in 2003.
By Year 15, the 2000 pension pot was reduced by 15% to £84,438, whilst the 2003 fund had more than doubled (+128%) to £227,953.
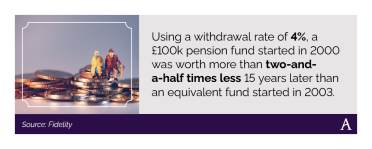
These results show the 2003 pension pot grew more than two-and-a-half times bigger than the one beginning in 2000. This was despite only 3 years between their starting points, meaning they shared the same market return for 80% of their investment period.
This can be explained by the ‘dot-com’ crash at the turn of the century, which saw stock markets fall dramatically between March 2000 and December 2002. Therefore, a retirement fund that began withdrawing at the start of 2000 would have been badly affected, while the pension pot that started withdrawing in 2003 would have enjoyed the economic recovery that took place.
This highlights the impact that macroeconomics can have on your pension pot, particularly if you start withdrawing money at the wrong time.
In terms of the best time of year to retire, some believe this is better at the start of the tax year (i.e. after 6 April), so that you start with a clean slate. By taking home a salary and a pension within the same year, you may fall into a higher income tax bracket.
This may also allow you to make the most of tax relief on your pension contributions up to the end of the previous year.
It’s advisable to seek professional advice and guidance before making any decisions about your financial future.
How much money do you need to retire?
According to Retirement Living Standards, the amount of money needed for a single person to retire on is £14,400 a year (assuming they are mortgage/rent-free by this stage in their life). This is considered enough to provide the minimum level of expenditure, standard of living, and quality of life once they stop working.
For this amount, all of their basic senior living needs should be covered, with some leftovers for luxuries. This would however be unlikely to cover the cost of owning and running a car, whilst holidays are likely to be reduced to UK-based destinations.
A breakdown of the UK’s retirement living standards for a single person
| Minimum | Moderate | Comfortable | |
|---|---|---|---|
| Income required |
£14,400 a year |
£31,300 a year |
£43,100 a year |
| What standard of living could you have? |
Covers all your needs, with some leftovers for fun |
More financial security and flexibility |
More financial freedom and some luxuries |
| House |
DIY £100 a year to maintain the condition of your property. |
Some help with maintenance and decorating each year. |
Replace kitchen and bathroom every 10/15 years. |
| Food |
Around £50 a week on groceries, £25 a month on food out of the home, £15 per fortnight on takeaways. |
Around £55 a week on groceries, £30 a week on food out of the home, £10 a week on takeaways, £100 a month to take others out for a monthly meal. |
Around £70 a week on food, £40 a week on food out of the home, £20 a week on takeaways, £100 a month to take others out for a monthly meal. |
| Transport |
No car, £10 per week on taxis, £100 per year on rail fares. |
3-year-old small car, replaced every 7 years, £20 a month on taxis, £100 per year on rail fares. |
3-year-old small car, replaced every 5 years, £20 a month on taxis, £200 per year on rail fares. |
| Holidays & leisure |
A week-long UK holiday. Basic TV and broadband plus a streaming service. |
A fortnight 3* all-inclusive holiday in the Med and a long weekend break in the UK. Basic TV and broadband plus two streaming services. |
A fortnight 4* holiday in the Mediterranean with spending money and 3 long weekend breaks in the UK. Extensive bundled broadband and TV subscriptions. |
| Clothing & personal |
Up to £630 for clothing and footwear each year. |
Up to £1,500 for clothing and footwear each year. |
Up to £1,500 for clothing and footwear each year. |
| Helping others |
£20 for each birthday and Xmas present. £50 a year charity donation. |
£30 for each birthday and Xmas present, £200 a year charity donation, £1,000 for supporting family members (eg paying for grandchildren's activities). |
£50 for each birthday and Xmas present, £25 per month charity donation, £1,000 family support. |
| Source: Pensions and Lifetime Savings Association | |||
For a moderate level of retirement, a single person would need to bring in at least £31,300 a year during their retirement. This would provide more financial stability, as well as allow for further luxuries, such as a small car, a foreign holiday, and around twice as much disposable income for clothing, decorating, and various leisure activities.
To obtain a comfortable standard of living during retirement, the average UK adult will need to earn approximately £43,100 a year – almost 3 times more than the minimum amount. This will provide retirees with a lot more financial freedom and luxuries during their senior living years, such as upgrading their property, a better, more modern vehicle, multiple holidays a year, and more disposable income to spend on presents for other people.
A breakdown of the UK’s retirement living standards for a couple
| Minimum | Moderate | Comfortable | |
|---|---|---|---|
| Income required |
£22,400 a year |
£43,100 a year |
£59,000 a year |
| What standard of living could you have? |
Covers all your needs, with some leftovers for fun |
More financial security and flexibility |
More financial freedom and some luxuries |
| House |
DIY £100 a year to maintain the condition of your property. |
£500 a year to maintain the condition of your property, £300 contingency. |
£600 a year to maintain the condition of your property, £300 contingency. |
| Food |
Around £95 a week on groceries, £50 a month per couple on food out of the home, £30 a month per couple on takeaways. |
Around £100 a week on groceries, £60 a week per couple on food out of the home, £20 a week per couple on takeaways, and £100 a month to take others out for a monthly meal. |
Around £130 a week on food, £80 a week per couple on food out of the home, £30 a week per couple on takeaways, and £100 a month to take others out for a monthly meal. |
| Transport |
No car, £15 per week for the couple on taxis, £100 per year per person on rail fares. |
3-year-old small car, replaced every 7 years, £20 a month on taxis per household, £100 a year on rail fares per person. |
3-year-old small car, replaced every 5 years, £20 a month on taxis per household, £200 a year on rail fares per person. |
| Holidays & leisure |
A week-long UK holiday. Basic TV and broadband plus a streaming service. |
A fortnight 3* all-inclusive holiday in the Med and a long weekend break in the UK. Basic TV and broadband plus two streaming services. |
A fortnight 4* holiday in the Med with spending money and 3 long weekend breaks in the UK. Extensive bundled broadband and TV subscriptions. |
| Clothing & personal |
Up to £630 for clothing and footwear each year. |
Up to £1,500 for clothing and footwear each year. |
Up to £1,500 per person for clothing and footwear each year. |
| Helping others |
Twelve gifts of £20 for birthdays and the same amount for 12 Christmas presents. £50 per person a year for charity donations. |
Twelve gifts of £30 for each birthday and the same amount for 12 Christmas presents, £200 per household a year for charity donations. £1,000 for supporting family members e.g. paying for grandchildren's activities, treats, trips etc. |
Twelve gifts of £50 for each birthday and the same amount for 12 Christmas presents, £25 per person per month for charity donations. £1,000 for supporting family members e.g. paying for grandchildren's activities, treats, trips etc. |
| Source: Pensions and Lifetime Savings Association | |||
Note: A monthly management fee applies to the sale of all retirement properties at Audley Villages, along with a deferred management charge at the point of sale. More information can be found about our fees.
For the average retired couple in the UK, they will need to have a joint household income of at least £22,400 post-retirement (assuming they are mortgage/rent-free by this stage). Similar to the single-person household, this will allow for a basic standard of living – covering all essential expenses with some left over for leisure and recreation.
Food bills should come to no more than £460 a month and the chance of owning a vehicle on this level of income is unlikely. Holidays are probably going to be UK-based, with either a week-long vacation or a couple of short breaks per year.

For moderate senior living standards, a UK couple would need almost double the minimum amount, at £43,100 between them. With this comes financial security and a greater level of disposable income to spend on luxuries. For example, monthly food bills could now reach £740, a small vehicle could be purchased, holidays may become outside of the UK, and more could be spent on presents and supporting family members financially.
To obtain a comfortable standard of living once retired, a typical UK couple should expect to jointly earn £59,000 a year. Like those living on their own, the financial freedom this brings could be considerable, as well as the opportunity to treat themselves more during the later years of their lives.
Monthly food bills may now exceed £1,000, with enough disposable income to own a better vehicle, go on multiple domestic and foreign holidays a year, and purchase more expensive gifts for others when it comes to birthdays and Christmas time.
UK holiday statistics after retirement
According to a consumer research report by Audley Villages, more than half (54%) of over 55s were looking forward to holidays in 2022 more than ever before, with over a fifth (22%) planning to take more holidays that year to make up for lost time due to the pandemic.
Three-quarters (75%) of UK adults surveyed said they were planning on going away during 2022, with an average number of trips at 3 per person.
However, the need to holiday was not welcomed by all people, with a number expressing concerns about taking an extended trip of over a month.
The biggest worries of over 55s when going on holiday for more than 30 days were:
- Security of property (49%)
- Something going wrong with their house (40%)
- Leaving pets behind (28%).
Impact of the cost of living crisis on coping financially during retirement
According to a 2024 report from the FCA, the UK’s retired population appears to be coping better with the cost of living crisis than their younger counterparts.
The survey of 3,450 individuals found that more than two-fifths (41%) of those over 75, and around a third (34%) of people aged 65-74, were financially managing themselves very well.
A breakdown of the extent to which the retired population are coping financially during the cost of living crisis
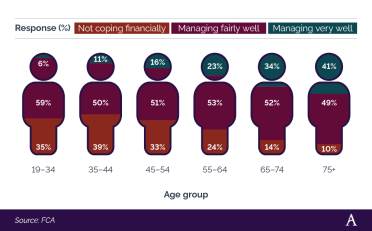
Around 1 in 7 (14%) 65-74-year-olds admitted to not coping well financially during this period – a figure that dropped to 1 in 10 (10%) for the over 75s.
In contrast, more than a third (35%) of 19-34-year-olds admitted not coping financially amidst the cost of living crisis, with just 6% believing they are managing very well.
A breakdown of the extent to which the retired population has coped with paying bills and credit commitments during the cost of living crisis
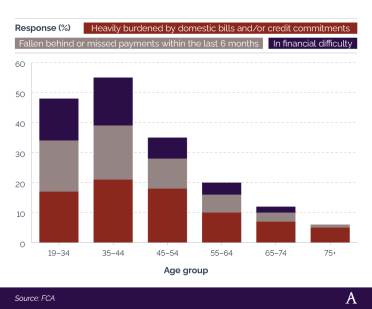
In terms of paying bills and keeping up with credit commitments, those in the UK retired population seem to be coping better than younger sections of society.
No respondents over the age of 75, and just 2% of the 65-74 cohort, claimed to be in financial difficulty – a figure that reached 16% for those between 35-44 years old.
Incidentally, just 7% of 65-74-year-olds surveyed felt they were heavily burdened by domestic bills and/or credit commitments, dropping to 5% for the over 75s. Conversely, more than a fifth (21%) of 35-44-year-olds felt the same – almost 4 times more by comparison.
Finally, just 4% of those aged 65+ admitted to falling behind with a bill payment in the previous 6 months. The respective figure for those aged 19-44 was more than a third (35%).
UK ill health retirement statistics
According to the most recent ONS data, there were around 2.5 million people classed as economically inactive due to long-term sickness as of May 2023, with 412,329 of these coming in Q2 2023 alone.
A breakdown of cumulative change in economic inactivity in the UK due to long-term sickness (2020–23)
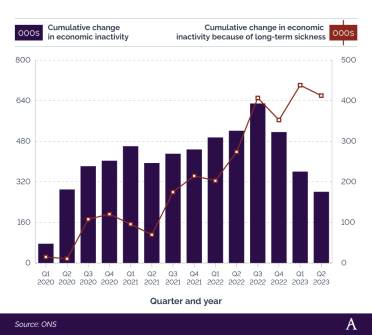
These figures have been on a generally upward trajectory since Q1 2020 when the cumulative change in the number of people off work with long-term sickness stood at just 15,112. After multiple quarters of fluctuating figures, this resulted in a peak of 438,042 more people off work due to ill-health in Q1 2023 than previously on record and almost 30 times more than the start of 2020.
A breakdown of the proportion of people reporting long-term health problems
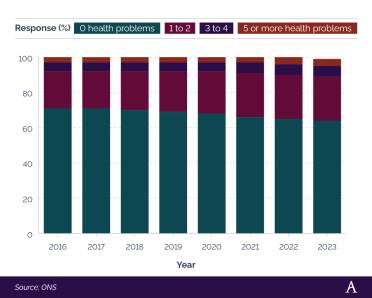
As of 2023, just under two-thirds (64%) of the UK population reported no health problems – a figure that has decreased gradually since 2016 when the respective percentage stood at 71%.
Incidentally, 1 in 4 (25%) people in the UK now have 1 or 2 reported long-term health problems – a 4% rise from 2016.
Just 6% of the UK in 2023 had 3 or 4 long-term health conditions, with around 1 in 25 (4%) reporting 5 or more. Both of these figures indicate a 1% increase from 2016 data sources.
A breakdown of the number of people inactive from work due to long-term health problems

In 2023, there were almost 937,000 people across the UK with 5 or more long-term health problems – the most common amount reported by the ONS. This represented a rise of almost a fifth (17.1%) from 2022 and an increase of more than two-fifths (42%) from 2019.
During this same period, the number of people reporting 1 or 2 health problems rose by more than a sixth (16.9%) to just under 875,000 in 2023. Likewise, the number of UK citizens with 3 or 4 health issues that prevent them from working increased by almost a quarter (23.2%) between 2016-23 to around 679,000.
In all, this means, almost two-fifths (37.6%) of UK residents were out of work due to 5 or more long-term illnesses in 2023. Just over a third (35.1%) were attributed to just 1 or 2 conditions with more than a quarter (27.3%) being down to 3 or 4 registered health issues.
What medical conditions qualify for ill-health retirement?
According to the ONS, the most common cause of economic inactivity due to long-term ill health in 2023 was depression, bad nerves, and anxiety. In all, some 1.35 million people signed off work for the long term for this reason in 2023 – a rise of two-fifths (40%) from 2019.
This was followed by problems with legs or feet (just over a million) and back or neck (just under a million), both of which saw respective increases of 29.2% and 27.8% from 2019.
A breakdown of the most common conditions that lead to economic inactivity in the UK (2019 vs. 2023)
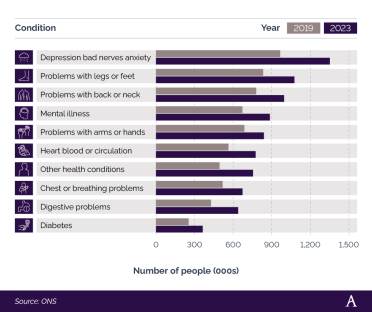
Mental illness was the fourth most common cause of long-term economic inactivity in 2023, accounting for almost 885,000 people being out of work for that year – a rise of almost a third (31.7%) from 4 years previous.
What happens when you retire in the UK?
Knowing where you will be living once you retire can be a daunting prospect, especially for those with a degree of uncertainty in their lives.
A consumer research survey from Audley Villages found that, in 2022, more than a fifth (21%) of UK adults claimed the lack of housing options available for the future was causing them immense stress, with two-fifths (40%) worried about senior living and having to move into a care home.
When considering their future care needs,
- Almost 2 in 5 (38%) said the thought of having to move into a care home was detrimental to their mental health, yet a similar percentage (39%) would prefer to move into a retirement village or housing with assisted living/care.
- Three-quarters (75%) of UK adults want to continue living at home with professional help coming to them – this rises to 87% for the over 55s.
- Around two-thirds (65%) preferred not to think about their future care and support needs at this moment in time.
- Three-fifths (60%) didn’t know what to do about their care options in later life.
Perhaps most importantly, just under half (49%) of adults surveyed don’t mind how they are cared for as long as they are safe.
Want to experience a luxury retirement village to see if it’s for you? Check out our blog on what life is like in the village from the perspective of our homeowners.
You can also check out our reviews to hear from our owners and prospective owners on why they have chosen to be part of the Audley community.
UK retirement home statistics
According to ARCO, there are around 70,000 integrated retirement communities in the UK that provide homes for almost 90,000 older people.
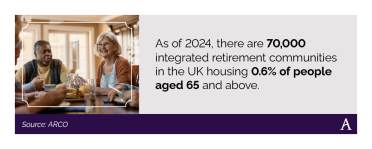
The need for more integrated retirement communities could not be greater. As of 2024, just 0.6% of over-65s in the UK currently live in an integrated retirement community, compared to between 5-6% in New Zealand, Australia, and the US. However, with the UK care sector aiming to provide homes for 250,000 older people by 2030, this offers an exciting prospect for future senior living opportunities across the country.
Benefits of integrated retirement communities
Residents of integrated retirement communities report several benefits when it comes to improved health and wellness in later life.
Notable positives include:
- A 75% increase in the amount of exercise done
- Reduced cases of falls within 2 years
- A quarter (24%) decrease in anxiety with only 1% saying they feel isolated
- Reduced costs of up to two-fifths (38%) relating to GPs, nurses, and hospital visits, rising to 51.5% for frailer residents
- A decrease in average unplanned hospital stays from 8-14 days down to 1-2 days.
If the planned target of 250,000 homes by 2030 is met, this could have significant cost savings for health and social care by an estimated £5.6 billion.
There are also positive knock-on effects for the housing market, with around three-quarters (76%) of owners and residents releasing at least 1 bedroom when they move into an integrated retirement community.
On average, each new resident releases 1.25 bedrooms. This means that, by 2030, there could be 562,000 additional bedrooms on the general market as a direct result of older people moving into integrated retirement communities.

As of 2024, more than two-fifths (43%) of housing equity is owned by someone over 65.
By opting to move into these communities, elderly people will help unlock housing stock that can be shared more evenly across the general population and enable more younger people to access the housing ladder.
Each new integrated retirement community of 250 units should create approximately 63 permanent jobs across the sector, at a ratio of 1 new job for every 4 units built.
In addition, for every 50,000 homes built, this should create employment for 75,000 people in the construction industry, with a turnover of £70 billion and £40 billion worth of investment by 2030.
For more information, check out our Audley stories from CEO Nick Sanderson on luxury retirement, wellbeing, the wider industry, and more.
A breakdown of the most common reasons for wanting to move to an integrated retirement community
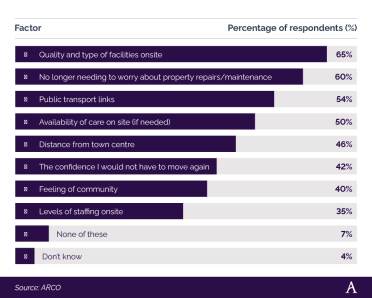
The reasons why people move to a retirement village can be affected by numerous factors.
In a survey of 4,000 older UK adults, ARCO found that the main motivation for people wanting to move into an integrated retirement community was the quality and type of facilities onsite, as stated by almost two-thirds (65%) of respondents.
Two-fifths (60%) of people liked the idea of no longer needing to worry about household maintenance and repair work, whilst just over half (54%) cited the appeal of better public transport links as a pull factor.
The availability of care services was also an important consideration for half of the people surveyed when considering whether to move into a retirement community.
The Audley Villages website is full of information on how retirement villages work and what is included. Audley Villages consider a range of purchase options to suit the individual, such as a home-buying service to make that transition even smoother for a stress-free moving experience.
Levels of happiness in retirement
According to the most recent ONS data, those of retirement age in the UK tend to score highest amongst all groups regarding happiness, general life satisfaction, and how worthwhile they perceive their life to be.
Wellness in later life is a key factor in perceived quality of life and satisfaction levels.
With an average happiness rating of 7.75 out of 10 for happiness, those in the retired population scored:
- Around 6.13% higher than younger adults
- Almost 6.2% higher than those of middle age
- Approximately 5.84% higher than all other UK adults.
A breakdown of how happy, worthwhile, and satisfied people consider their life to be after retirement in the UK
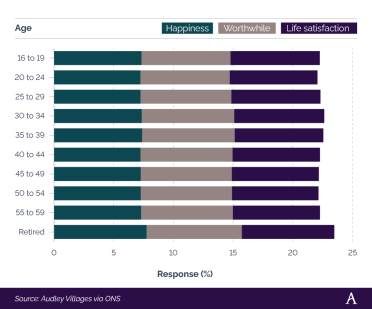
Similar trends were seen when asked to rate how worthwhile they perceived their life to be, with an average of 7.98 out of 10 compared to 7.45 for 16-19-year-olds.
Finally, retired people in the UK tend to be more satisfied with their life in general. With an average of 7.74, this was higher than any other age bracket and almost 6% more than the UK’s middle-aged population.
Rates of anxiety and depression after retirement in the UK
Another significant part of your wellness in later life is your mental health and state of mind, particularly the extent to which you develop feelings of anxiety and depression.
Research from Age UK shows that almost half of people in their 50s admit to not sleeping well in the 12 months to March 2024. Approximately 2 in 5 (42%) reported higher levels of anxiety than normal during this time and around 1 in 5 (20%) felt as though they were not looking after themselves properly compared to 2023.
A breakdown of the proportion of over-50s who have felt more anxious in the last 12 months
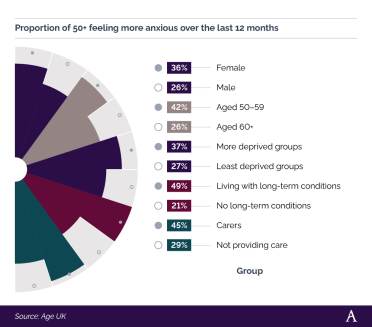
When broken down by demographic group, a greater proportion of females reported increased feelings of anxiety between 2023-24 compared to males, at more than a third (36%) vs. just over a quarter (26%), respectively.
The Age UK study also found that:
- Anxiety levels seem to drop with age, from just over two-fifths (42%) of those aged 50-59 down to around a quarter (26%) for the over 60s.
- Almost two-fifths (37%) of those from more deprived groups indicated higher anxiety between 2023-24 compared to just over a quarter (26%) for those from least deprived groups.
- Those living with long-term health conditions are more than twice as likely to suffer from increased levels of anxiety (49% vs. 21%)
- Almost half (45%) of UK carers reported increased anxiety in 2024 compared to 2023 contrasted by less than a third (29%) of those not providing care.
A breakdown of the proportion of over 60s who reported feeling more anxious (2021-23)
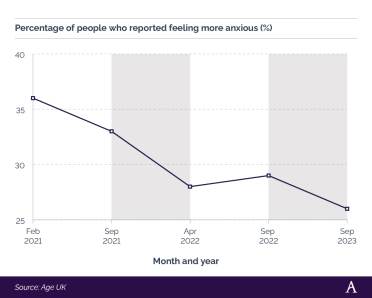
As of 2023, just over a quarter (26%) of the UK population reported feeling more anxious compared to 12 months earlier.
This represents a decrease of 10% since February 2021, when more than a third (36%) noted the same feelings.
Consumer research by Audley Villages in 2022 also highlighted that trends of loneliness are not just endemic to the elderly population.
Around half (49%) of UK adults surveyed experienced feelings of loneliness over the previous 12 months. When broken down, this was:
- More than three-quarters (77%) of those aged 20-29
- Around two-thirds (65%) of those in their 30s
- Just under two-fifths (38%) for the over 55s.
For those who have experienced loneliness in later life, it has led to several ways in which they would like to live their life either now or in the future.
A key part of this solution is developing your social wellness and encouraging an active retirement. Just over a quarter (26%) vow to keep themselves occupied with activities and social groups, with around 1 in 6 (16%) wanting to be part of a strong integrated retirement community when they grow old.
For more information, check out our blog on wellbeing and self-care advice in older age.
We also organise a range of events throughout the year to showcase our beautiful villages and lifestyle offered to our residents.
A breakdown of the proportion of people accessing secondary mental health, learning disability, and autism services in England by age (2022–23)
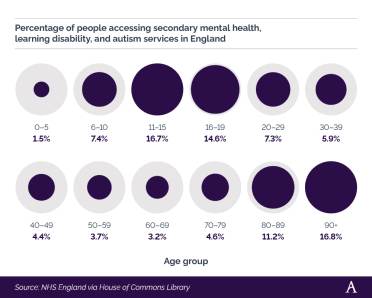
Wellness in later life can be significantly improved by having access to the right services as and when you need them.
Data published by NHS England shows that those aged 90 and above tend to use secondary mental health services more than any other age group. As of 2022-23, more than 1 in 6 (16.8%) patients accessing these services were over the age of 90, followed very closely by 11-15-year-olds (16.7%).
Those aged 80-89 were the fourth most common group to access NHS mental health services in 2022-23, at roughly 1 in 9 (11.2%) appointments. This was marginally behind 16-19-year-olds, which accounted for approximately 1 in 7 (14.6%) appointments for the year.
A breakdown of the proportion of people aged 65+ who rated their health as ‘good’ or ‘not good’ in each region of England and Wales
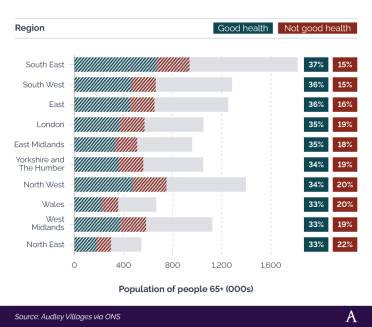
| Region | Good | Not good | Population aged 65+ |
Percentage 'good' |
Percentage 'not good' |
|---|---|---|---|---|---|
| South East | 670,235 | 266,365 | 1,816,576 | 37% | 15% |
| South West | 467,022 | 194,894 | 1,282,133 | 36% | 15% |
| East | 451,636 | 198,972 | 1,251,123 | 36% | 16% |
| London | 367,447 | 202,709 | 1,050,904 | 35% | 19% |
| East Midlands | 334,848 | 175,918 | 957,801 | 35% | 18% |
| Yorkshire & the Humber |
360,823 | 199,660 | 1,047,500 | 34% | 19% |
| North West | 474,556 | 274,047 | 1,394,982 | 34% | 20% |
| Wales | 222,967 | 133,060 | 665,805 | 33% | 20% |
| West Midlands | 373,640 | 209,360 | 1,123,552 | 33% | 19% |
| North East | 179,288 | 118,003 | 544,473 | 33% | 22% |
| Source: Audley Villages via ONS | |||||
By contrast, those in the North East believe they have the worst health of all UK regions, with only a third (33%) of residents claiming to be in ‘good’ health and more than a fifth (22%) rating their health as ‘not good’ – the highest percentage across all UK regions.
A breakdown of the top 10 and bottom 10 local authorities in England and Wales for people aged 65+ who rated their health as ‘good’
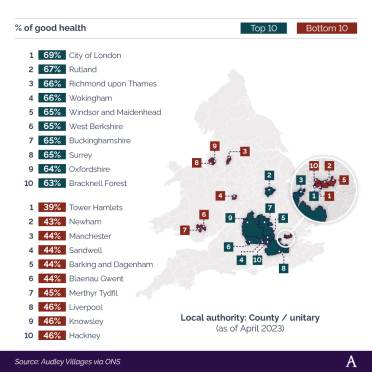
| Local authority (as of April 2023) |
Good | Not good | Population aged 65+ |
Percentage 'good' |
|---|---|---|---|---|
| City of London | 856 | 337 | 1,240 | 69% |
| Rutland | 6,935 | 3,193 | 10,386 | 67% |
| Richmond upon Thames |
21,022 | 9,738 | 31,651 | 66% |
| Wokingham | 20,394 | 9,361 | 30,779 | 66% |
| Windsor & Maidenhead |
18,563 | 8,797 | 28,510 | 65% |
| West Berkshire | 20,616 | 10,310 | 31,789 | 65% |
| Buckinghamshire | 67,549 | 33,584 | 104,473 | 65% |
| Surrey | 147,604 | 72,052 | 228,583 | 65% |
| Oxfordshire | 83,357 | 42,709 | 130,858 | 64% |
| Bracknell Forest |
12,054 | 6,542 | 19,009 | 63% |
| Liverpool | 34,361 | 37,745 | 74,901 | 46% |
| Knowsley | 12,150 | 13,410 | 26,440 | 46% |
| Hackney | 9,592 | 10,571 | 20,730 | 46% |
| Merthyr Tydfil | 5,024 | 5,847 | 11,172 | 45% |
| Manchester | 22,897 | 27,536 | 52,606 | 44% |
| Sandwell | 21,767 | 26,678 | 49,994 | 44% |
| Barking & Dagenham |
8,495 | 10,027 | 19,136 | 44% |
| Blaenau Gwent | 6,067 | 7,170 | 13,638 | 44% |
| Newham | 11,018 | 13,798 | 25,491 | 43% |
| Tower Hamlets | 6,944 | 10,163 | 17,623 | 39% |
| Source: Audley Villages via ONS | ||||
When broken down by local authority, those in more southern parts of the country tend to rate themselves as being in good health. More than two-thirds of people living in the City of London (69%) and Rutland (67%) believe they are in ‘good’ health, compared to less than two-thirds in Oxfordshire (64%) and Bracknell Forest (63%).
Conversely, several London boroughs scored low when it came to residents rating their health. Less than 2 in 5 (39%) of those living in Tower Hamlets deemed themselves to be in ‘good’ health with similar percentages reported in Newham (43%), Barking and Dagenham (44%), and Hackney (46%).
Death rates after retirement in the UK
As of April 2024, life expectancy statistics from the ONS indicate that women at the age of 66 (retirement age) can expect to live on average to 87. For men, the corresponding figure is 85.
It also shows that women aged 66 have a 5.5% chance of living to 100, compared with a 3.1% chance for men.
The most recent ONS stats for life expectancy at older ages estimate that those aged 65 could expect to leave another 19.6 years on average once they reach retirement age. These figures are slightly higher for females (20.8 years) compared to males (18.3 years).
Period life expectancy in the UK at 90 years of age averages 4.2 years (3.8 years for males and 4.5 years for females).
Period life expectancy is an estimation of how long a person is expected to live in a particular age group. It uses death rates from a single year and assumes those rates apply throughout the remainder of a person’s life to give an estimate of how much longer that person can be expected to live (on average).
A breakdown of the number of people in the UK aged 90 and above between 1990 and 2022
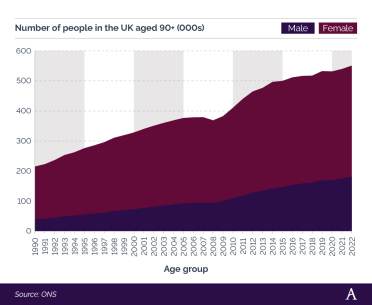
As of 2022, there were just over 550,000 people in the UK aged 90 and above, with the overwhelming two-thirds majority (67.2%) made up of women.
Despite a few blips, the number of UK residents aged 90+ has generally risen year-on-year since 1990. Back then, there were almost 215,000 people in this age bracket. However, by 2022, this figure had risen by more than two-and-a-half times (+156%) to 550,835.
UK retirement statistics vs the rest of the world
Average retirement age around the world
According to the World Population Review, the global average retirement age stands at around 62.6. For males, this is slightly higher (63.4) compared to females (62.0).
Lowest retirement age in the world
On average, the lowest retirement age around the world can be found in Asian countries. Of the 15 countries with an average retirement age below 60, 11 of them are located in Asia.
As of 2023, Sri Lanka had the lowest retirement age in the world across all countries, at 55 years for both men and women.
This is followed by 7 nations (China, Iran, Uzbekistan, Venezuela, North Korea, Oman, and Mongolia) who all recorded an average retirement age of 57.5 (60 for men and 55 for women).
Highest retirement age in the world
As of 2022, Libya registered the highest average retirement age of all global nations, at 70 for both men and women.
Generally speaking, the majority of countries with a high average retirement age are based in Europe. Of the 15 countries with a typical retirement age above 65, 11 of them are European.
The UK sits 12th on the list at 66 years for both men and women – a stat shared by Taiwan and Ireland.
A host of Scandinavian countries (Denmark, Norway, and Iceland) and some in the Mediterranean (Italy and Greece) all share an average retirement age of 67 – 3 years less compared to a typical Libyan citizen.
Pensionable age around the world (men vs women)
Since 1949, the UK pensionable age remained largely the same for men at 65 years old until it was increased to 66 after 2020. During this time, the corresponding age for women was 60, until it was increased to 65 in the mid-2010s and then 66 in 2020 to bring it in line with men.
By 2050, this is projected to have risen by another 2 years to 68 for both.
As it stands, this is the highest predicted pensionable age across all G7 countries. As of 2024, the full retirement age stands at 66, much like the UK. However, this is only predicted to rise by 1 year by 2050.
To date, France has the lowest pensionable age across all G7 countries. They bucked the trend as the only country to decrease their retirement age. Between 1958 and 2002, this dropped from 65 to 60, before increasing again in subsequent years. By 2050, this is expected to have reached 61 – some 1.5 years less than the UK’s average retirement age in 1949.
A breakdown of the pensionable age for the UK and countries with similar economies (1949–2050)
Life expectancy after pensionable age around the world (men vs women)
Back in 1949, the average UK male could expect to live 11.9 years after retiring. By 2020, this had risen by 5.8 years to 17.7. This is contrasted by women, who were typically living 18.9 years after retirement in 1949. Yet, by 2020, this stood at 21.2 years – almost a fifth (18%) longer than men.
By 2050, these figures are expected to drop to 16.9 for men and 21.9 for women in the UK.
A breakdown of the life expectancy after pensionable age for the UK and countries with similar economies (1958–2050)
On average, the UK has the lowest life expectancy after pensionable age across all G7 countries and has done so since 1958. Life expectancy data for American females is broadly in line with their UK counterparts.
However, for the remaining nations, females are anticipated to live a lot longer once they retire. For example, women in France could live 29.5 years longer on average once they give up work by 2050 – around 7.6 years longer than the typical UK female.
A similar story is expected for French males at 24.8 years of life expectancy post-retirement. This is almost 8 years longer than the average UK male is expected to live in 2050 once they give up work and claim their pension.
Retirement FAQS
-
Can I retire at 60 and still claim a State Pension?
-
No; you cannot retire at 60 in the UK and still claim your State Pension. The earliest you can get your State Pension is once you reach your State Pension age, which is dependent on when your birthday is. As of 2024, this is 66 for both men and women.
-
What happens to my State Pension if I die before retirement?
-
Normally, your State Pension will stop being paid when you die. In some cases, your husband, wife, or civil partner (if you have one) could inherit a percentage of your State Pension. This can depend on the amount of National Insurance (NI) contributions you both made and when you reached or will reach the State Pension age.
It is possible to pass on your State Pension payments after death, but this must be to a spouse or civil partner. However, this is not possible if you die before you reach the State Pension age and after they’ve reached theirs.
-
What happens to my pension if I die after retirement?
-
If you die after choosing to retire, then what happens to your pension will depend on several factors, including the type of pension scheme you have in place.
With a defined benefit pension, any money will be paid to your beneficiaries as outlined by the rules of your scheme. This could be a spouse or civil partner, your children (providing they are under 23 and in full-time education, or mentally/physically impaired at any age), or anyone financially dependent on you when you die (including an unmarried partner).
For a defined contribution pension, the same applies. The main difference is how the money is taken out and the extent to which this becomes eligible for tax. Beneficiaries usually have 3 options: withdraw all funds as a lump sum, set up a guaranteed income (annuity) with the proceeds, or arrange a flexible retirement income plan known as a pension drawdown.
It’s worth getting financial advice before making any decisions on the above to ensure your beneficiaries are in the best possible position to handle your pension after you have died.
-
What happens to my NHS pension if I retire before retirement?
-
If you choose to retire early, then what happens to your NHS pension will depend largely on which scheme you’re on and when you joined the NHS.
- If you joined the 1995 section before 6 April 2006, you can opt for actuarially reduced early retirement from 50 and receive reduced benefits. Your pension and retirement lump sum will be reduced as they’re being paid earlier than expected. Any dependents you have will still get any entitled benefits in full.
- For those who joined in the 2008 Section, the minimum pension age is 55. You can choose to take voluntary early retirement from the minimum retirement age and receive reduced benefits. Similar to above, your pension is reduced to account for being paid early and your dependents will still get any entitlements.
- The same above applies to those joining in the 2015 Scheme.
As with all the schemes, the amount your pension is reduced depends on how soon you choose to retire. For more information, check out the NHS early retirement factsheet.
-
How many hours can you work after retirement in the UK?
-
There are currently no restrictions on how many hours you can work in the UK after you retire. At present, you are entitled to a personal, tax-free allowance of £12,570 a year. Any additional money you earn will be added to your pension income and anything above this threshold will be liable for tax.
If you do decide to return to work, it’s advisable to seek financial advice beforehand to make sure you can maximise your income without having to pay more tax than you need to.
-
What are the advantages and disadvantages of working after retirement in the UK?
-
The main advantage of working after retirement in the UK is that you’ll still have the opportunity to earn money and supplement your retirement income. This additional money can also be paid into your pension with the chance to maximise your employer’s contributions. It also allows you the chance to interact with people and maintain a sense of purpose, meaning, and structure in your week. This could also be an opportunity to retrain, take a new career path, and try something new.
The disadvantage of working after retirement is that work can become stressful and many want to just enjoy their retirement years relaxing, pursuing leisure activities and/or doing the things they couldn’t do whilst they were working. Returning to work may also involve committing to long and potentially unsociable hours. However, many use this as a negotiating tool to find a work pattern that benefits both employee and employer.
-
How much does a married couple need to retire in the UK?
-
According to the Retirement Living Standards set out by the Pensions and Lifetime Savings Association, a couple living in the UK need a joint household income of £22,400 a year to enjoy a minimum standard of living during retirement. For a moderate level of living, they should be earning at least £43,100 a year between them and for a comfortable lifestyle, this should be £59,000.
Retirement glossary
-
Annuity
-
A fixed sum of money paid out each year for the rest of your life.
-
Baby boomer
-
Someone born in the years after the Second World War (1946-64).
-
Defined contribution pension
-
A type of workplace pension that consists of your contributions alongside those of your employer and tax relief from the government.
-
Defined benefit pension
-
A type of workplace pension that guarantees you a specific income for the rest of your life.
-
Income drawdown
-
A flexible way to take money from your pension pot once you retire while allowing your pension fund to keep growing.
-
Economically inactive
-
Those people of working age (16-64) who are not employed and in paid work, but also not actively looking for work or available to take up employment.
-
Encashment
-
Taking out all of your retirement savings in one lump sum.
-
Gender pensions gap
-
The difference in retirement income or retirement wealth between men and women.
-
Ill health retirement
-
Accessing your pension pot early due to a health condition that prevents you from working.
-
Integrated retirement community
-
A retirement living option for older people once they have given up work that offers a combination of housing, care, and support services. Their goal is to facilitate independent living alongside any care needs and a sense of community.
-
Life expectancy
-
The average age that a person can expect to live from birth.
-
Millennials
-
A person born in the early 1980s/late 1990s, otherwise known as Generation Y.
-
Senior living
-
Housing and lifestyle options for people aged 55 and above which help them to adapt to the challenges of ageing. This can include apartments, private homes, and integrated retirement communities.
-
Uncrystallised Funds Pension Lump Sum (UFPLS)
-
Directly withdrawing money from your pension pot once you reach the minimum pension age (providing you haven’t accessed your funds in any other way, such as a drawdown scheme, buying an annuity, or taking a 25% tax-free lump sum).
-
Unretired
-
Someone who gives up work (i.e. retires) and then returns to the workforce later on.
-
Wellness in later life
-
An active process of personal growth whereby people become aware of, and make conscious choices, towards a better future as they get older.
- The State of Ageing
Centre for Ageing Better, 2023 - Population estimates for the UK
Office for National Statistics (ONS), 2022 - Official Census and labour market statistics
Nomis / ONS - Understanding Retirement in the UK
Institute for Fiscal Studies, 2023 - Milestones: journeying through modern life
ONS, 2024 - State Pension age Review 2023
Government policy paper - Over a third of baby boomers set to retire later than SPA
FT Adviser, 2022 - Nearly a quarter of baby boomer and late Gen X men are ‘unretiring’
Fortune, 2024 - Baby boomers forget retirement as graying of American workforce continues
Fortune, December 14 2023 - One in five young British adults expect to retire before 60
YouGov, March 22 2024 - Millennials are getting older – and their pitiful finances are a timebomb waiting to go off
The Guardian, March 6 2023 - What Gen Z and Millennials think about retirement
Standard Life, November 18 2021 - An intergenerational audit for the UK
Resolution Foundation, November 2022 - Early retirement, your pension and benefits
gov.uk - Minimum pension age
House of Commons Library, July 10 2024 - The Gender Pensions Gap in Private Pensions
Department for Work & Pensions (DWP), June 5 2023 - The best (and worst) years to retire: how timing affects your income
Fidelity International, September 14 2023 - When is the best time of year to retire? 12 tips from money experts
This Is Money, February 25 2023 - Retirement income market data 2022/23
Financial Conduct Authority (FCA), April 16 2024 - Pensioners' Incomes: financial years ending 1995 to 2023
DWP, March 21 2024 - Nearly one third of Brits not saving for retirement
Pensions Age, February 13 2023 - Saving for retirement in Great Britain: April 2018 to March 2020
ONS, June 17 2022 - The UK Pension Landscape
PensionBee, May 2024 - What is the average pension pot by age in the UK?
Charles Stanley & Co, July 17 2024 - One in six over-55s have no pension savings yet
Unbiased.co.uk, February 17 2023
- Picture Your Future: Retirement Living Standards
Pensions & Lifetime Savings Association - Financial Lives cost of living (Jan 2024) recontact survey
FCA, April 16 2024 - Rising ill-health and economic inactivity because of long-term sickness, UK: 2019 to 2023
ONS, July 26 2023 - An overview of the growing Integrated Retirement Community sector
Associated Retirement Community Operators (ARCO) - An IRC in Every Town
ARCO, June 2023 - Deeply troubling levels of mental ill-health among people in their fifties and over
Age UK, March 14 2024 - I just feel that no one cares: research into the mental health of people aged 50 and over
Age UK, March 2024 - Mental health statistics: prevalence, services and funding in England
House of Commons Library, March 1 2024 - National life tables – life expectancy in the UK: 2020 to 2022
ONS, January 11 2024 - Estimates of the very old, including centenarians, England and Wales: 2002 to 2022
ONS, January 11 2024 - Retirement Age by Country 2024
World Population Review - Pensionable Age and Life Expectancy, 1950-2050
Organisation for Economic Cooperation & Development, March 17 2011 - What happens to my pension when I die?
Marie Curie, April 1 2024 - Pension rules after death
PensionBee, May 31 2024 - Additional State Pension
gov.uk - NHS Pensions - Early Retirement factsheet
NHS Business Services Authority, May 2015 - Working after retirement
Legal & General, September 3 2024 - How Many Hours Can I Work After Retirement?
Liberty Partnership - What happens to my pension when I die?
MoneyHelp.org.uk - UK population data
Nomis / ONS - National population projections: 2021-based interim
ONS, January 30 2024 - Population projections for regions: Table 1
ONS, March 24 2024 - Personal well-being in the UK: April 2022 to March 2023
ONS, November 7 2023


